
Waste Management
End-to-End Visibility and Control Over Waste Data
Managing waste data across multiple sites, streams, and disposal methods is often fragmented and inconsistent. Sustainability teams must collect information from disparate sources, apply correct conversions and emission factors, and ensure data accuracy across reporting periods. This complexity makes it difficult to gain a clear view of waste performance and identify opportunities for reduction.
The Sustaira Waste Management Solution provides a centralized solution to capture, standardize, and analyze waste data across your organization. It enables sustainability teams to track waste at a granular level while automatically aggregating data across complex organizational structures.
Rather than relying on manual data collection and static spreadsheets, the Waste Management Solution leverages automation, built-in intelligence, and flexible configuration to transform waste data into a reliable and actionable asset.
Trusted by
Turning Complexity into Clarity
-
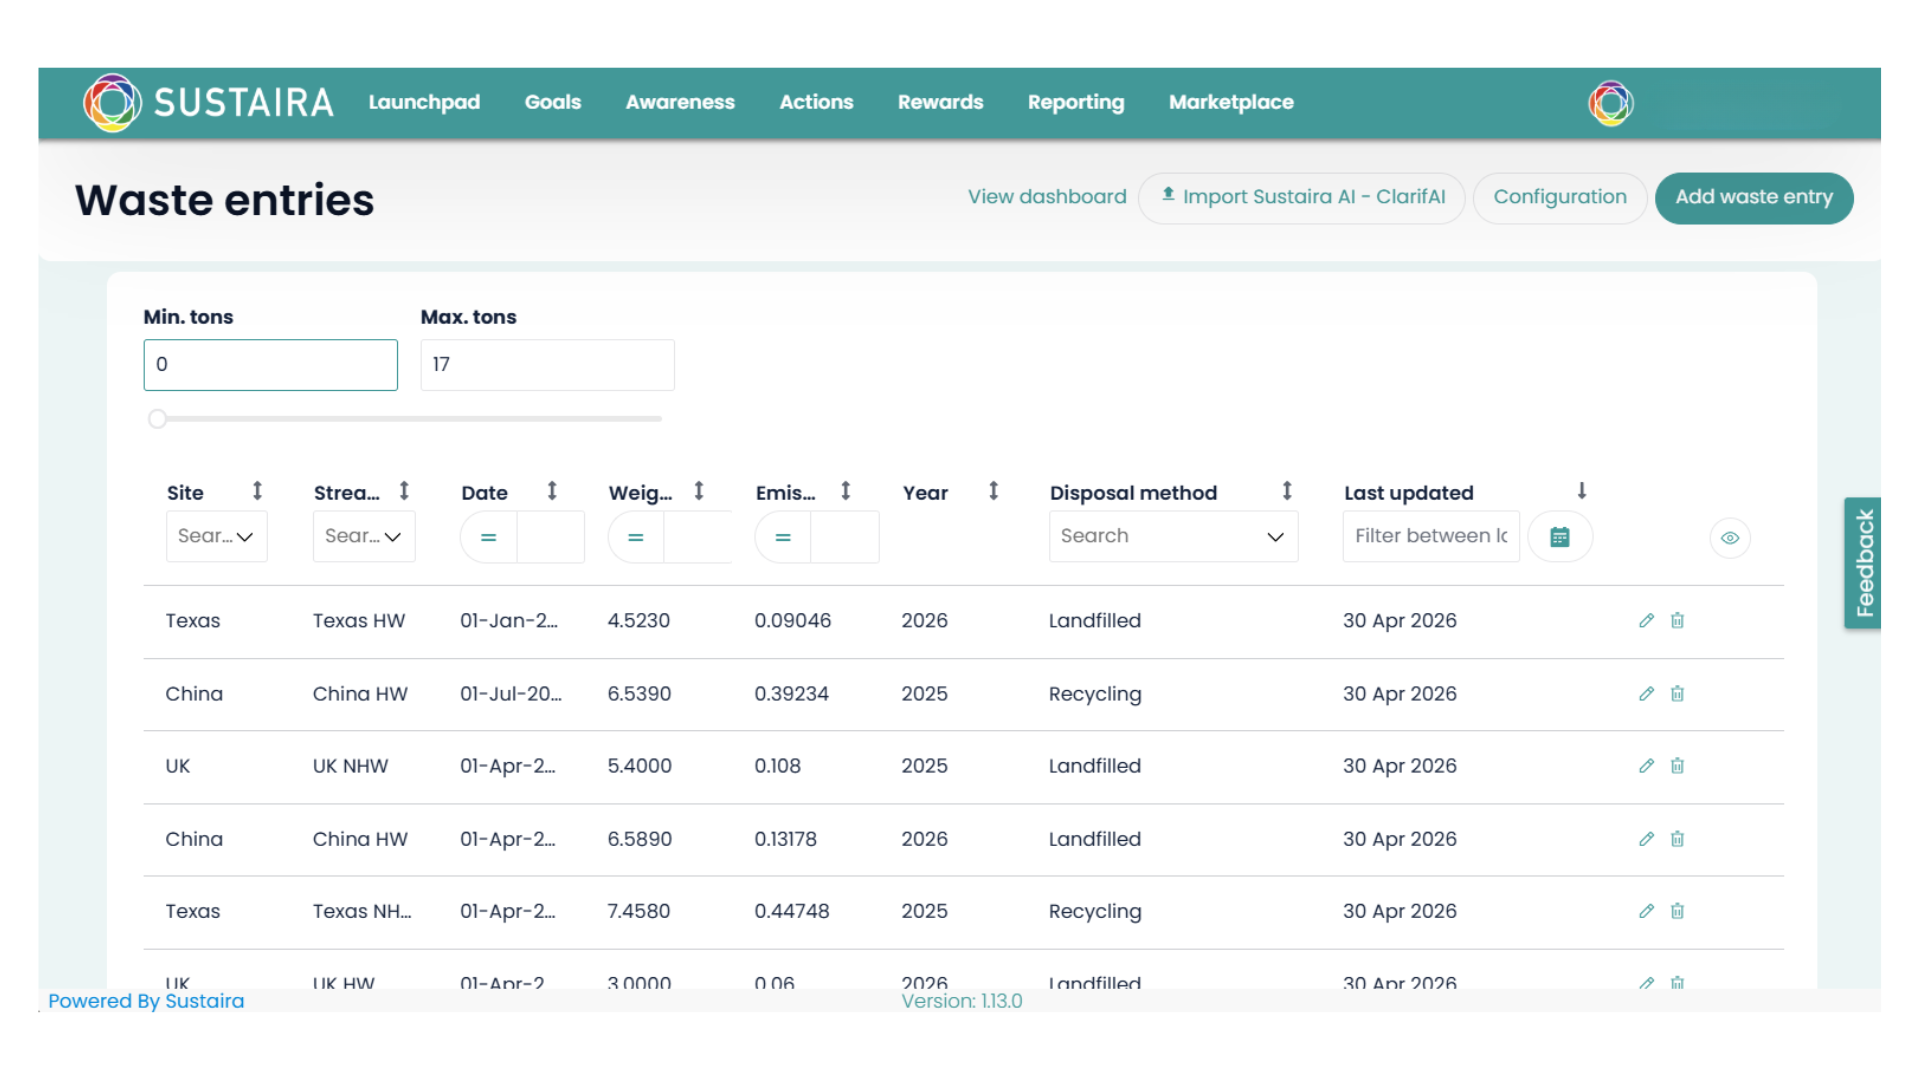
Waste data is often collected at site level using inconsistent formats, making it difficult to consolidate and analyze across the organization.
With Sustaira Waste Management Solution
Waste data is standardized and centralized, enabling tracking by site, waste stream, and disposal method while automatically rolling up into a unified organizational view. -
Applying the correct unit conversions and emission factors across reporting periods is time consuming and prone to errors.
With Sustaira Waste Management Solution
Built-in emission factors and unit conversions ensure consistency and accuracy, while allowing full flexibility to define and manage custom factors over time. -
Waste data is often stored in unstructured formats such as PDFs, requiring manual extraction and processing.
With Sustaira Waste Management Solution
OCR capabilities automatically extract relevant data from unstructured documents, accelerating data ingestion and reducing manual effort. -
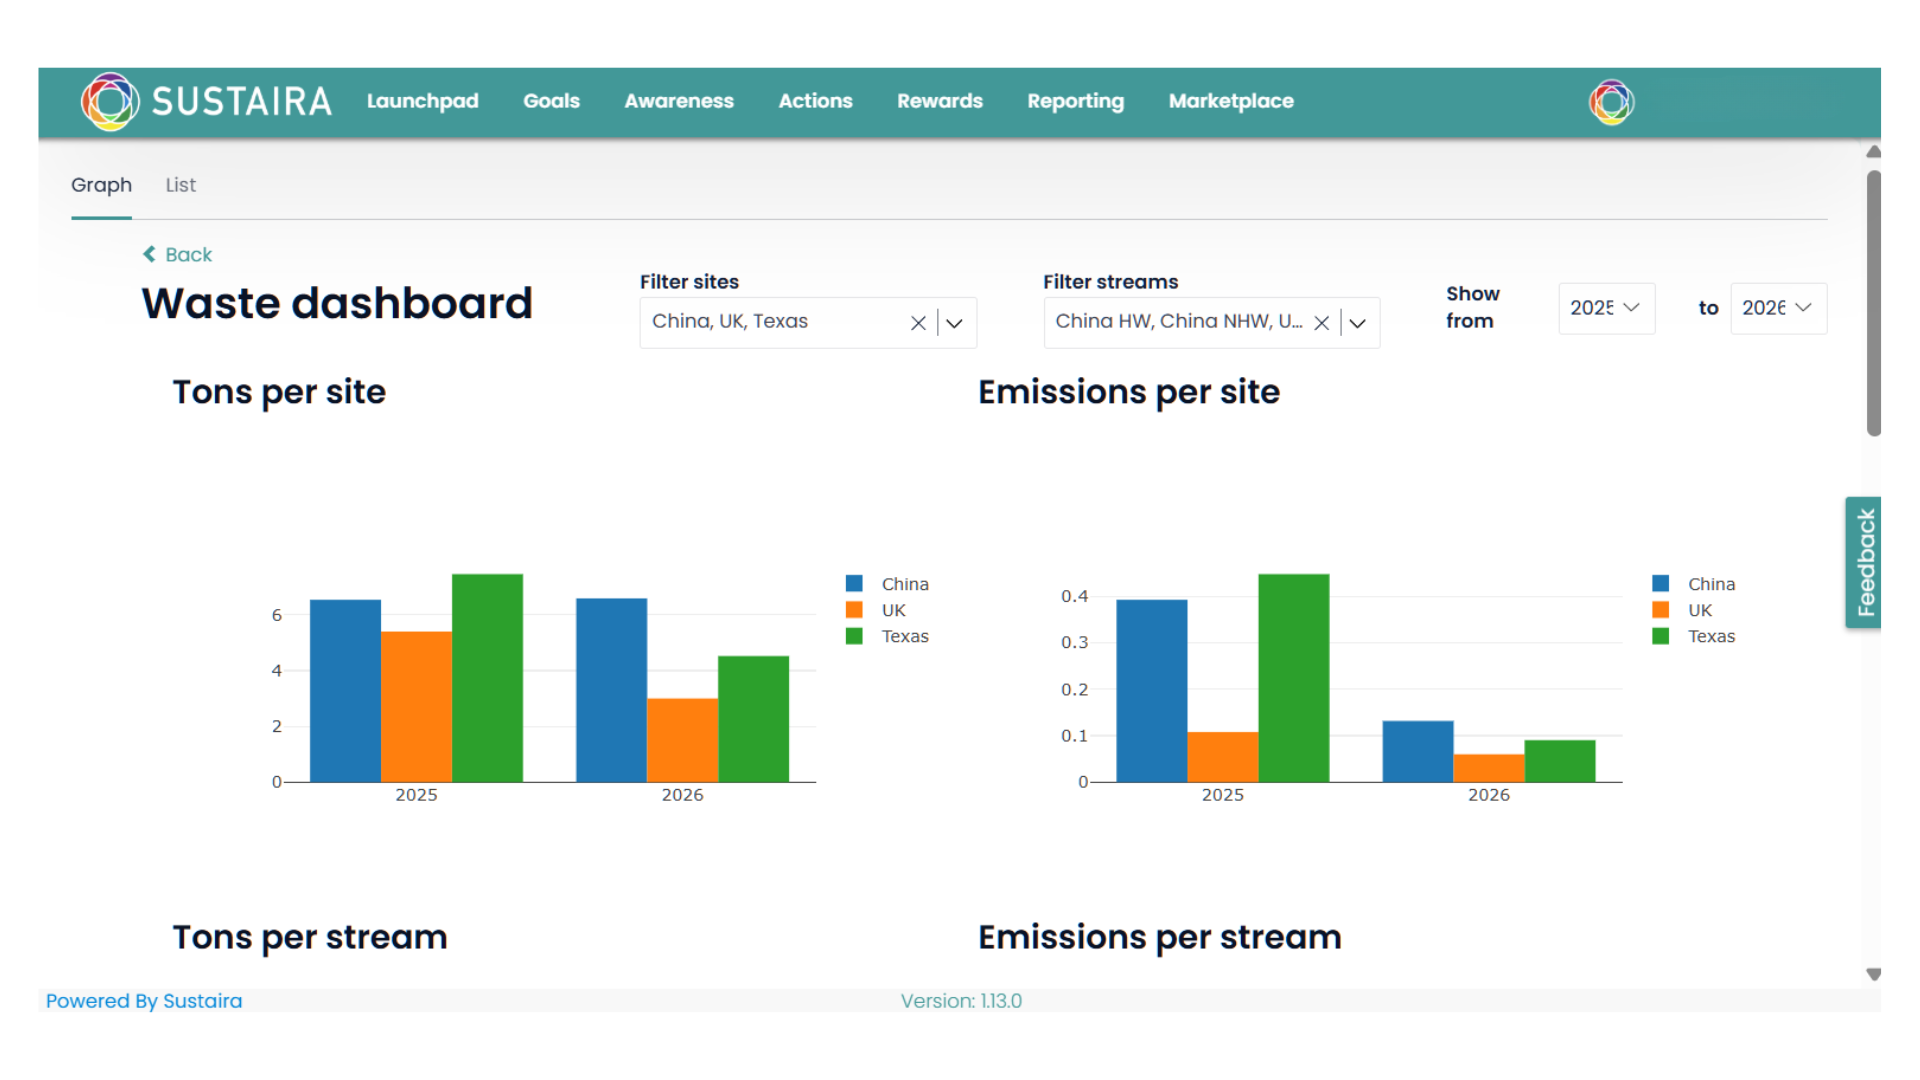
Organizations struggle to gain clear insights into waste generation patterns and disposal methods across different entities.
With Sustaira Waste Management Solution
Interactive dashboards and structured data models provide clear visibility into waste performance, enabling better monitoring and informed decision making.
Core Features
-
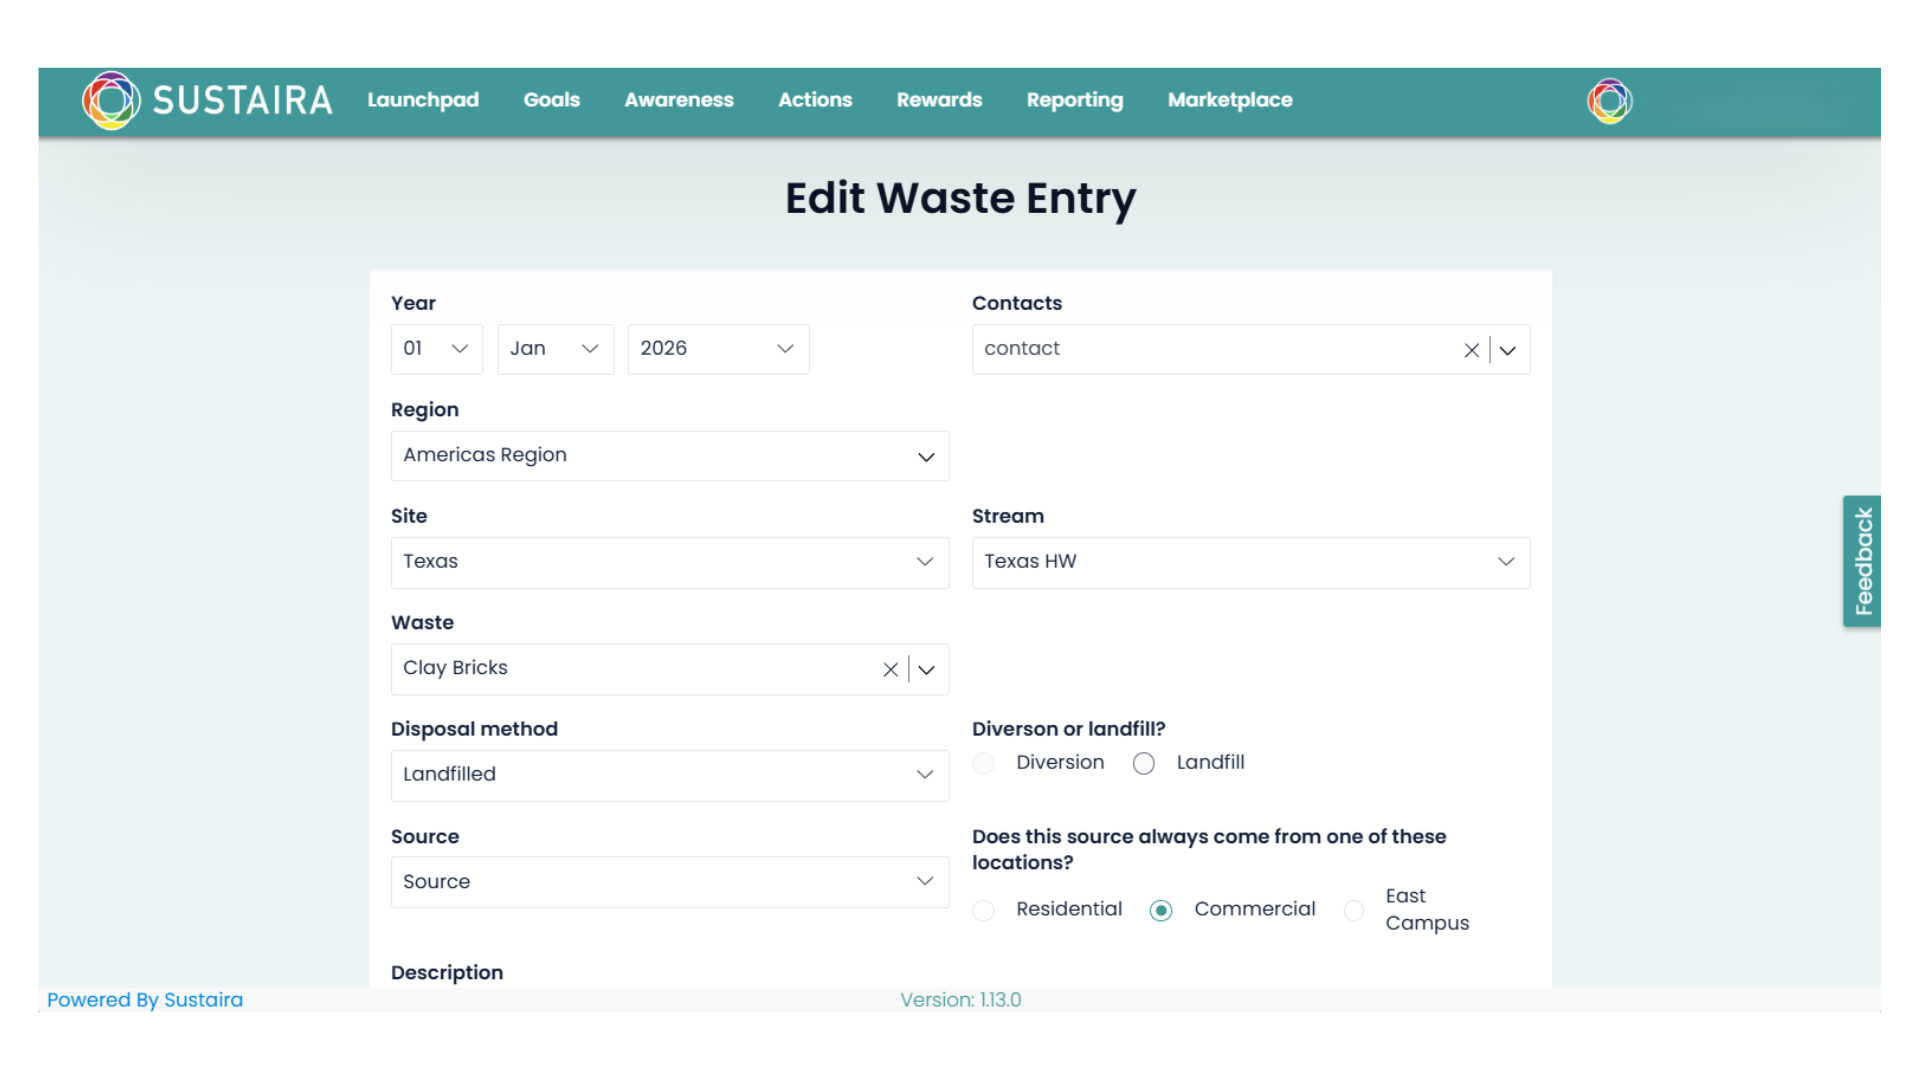
Granular Waste Data Management
Track waste data at the level of site, stream, and disposal method, with automatic aggregation across organizational hierarchies.
-
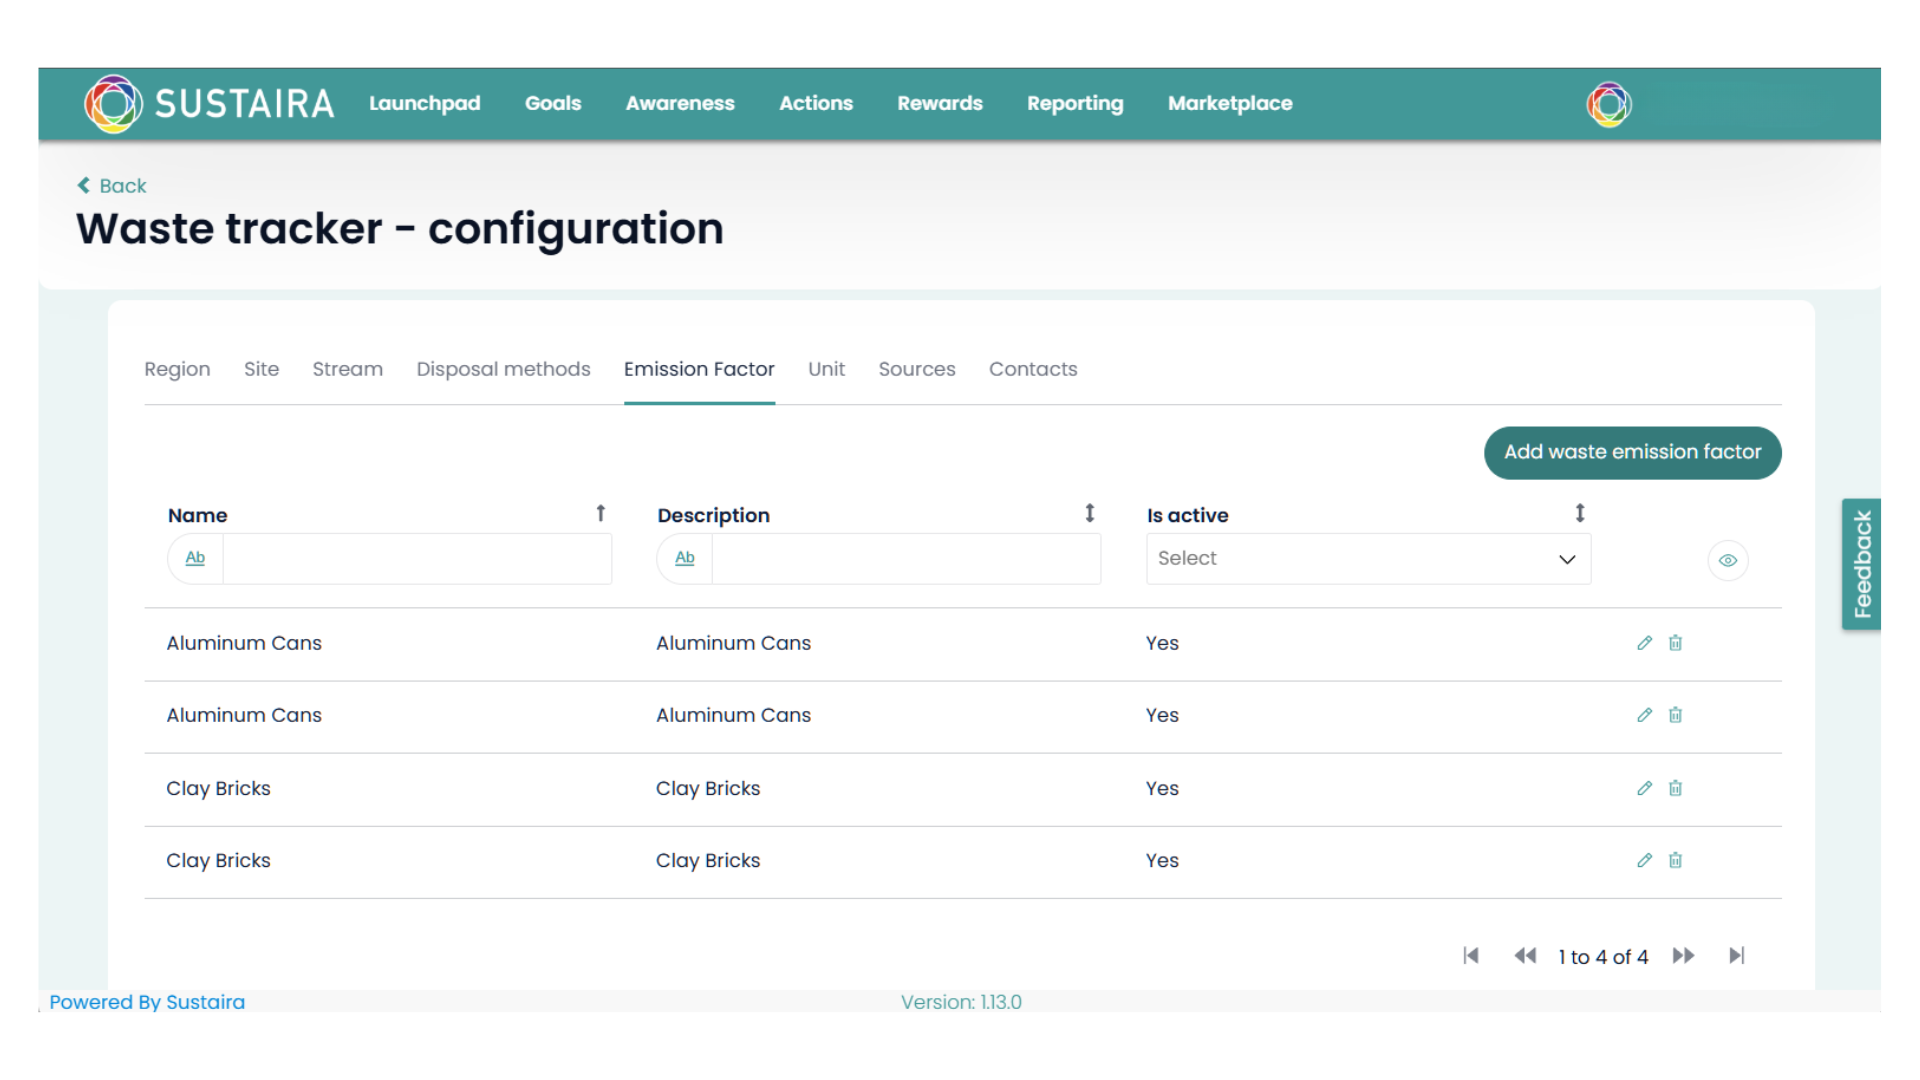
Built-in and Custom Emission Factors
Leverage Sustaira’s existing emission factors and unit conversions or define your own, with structured year-over-year management.
-
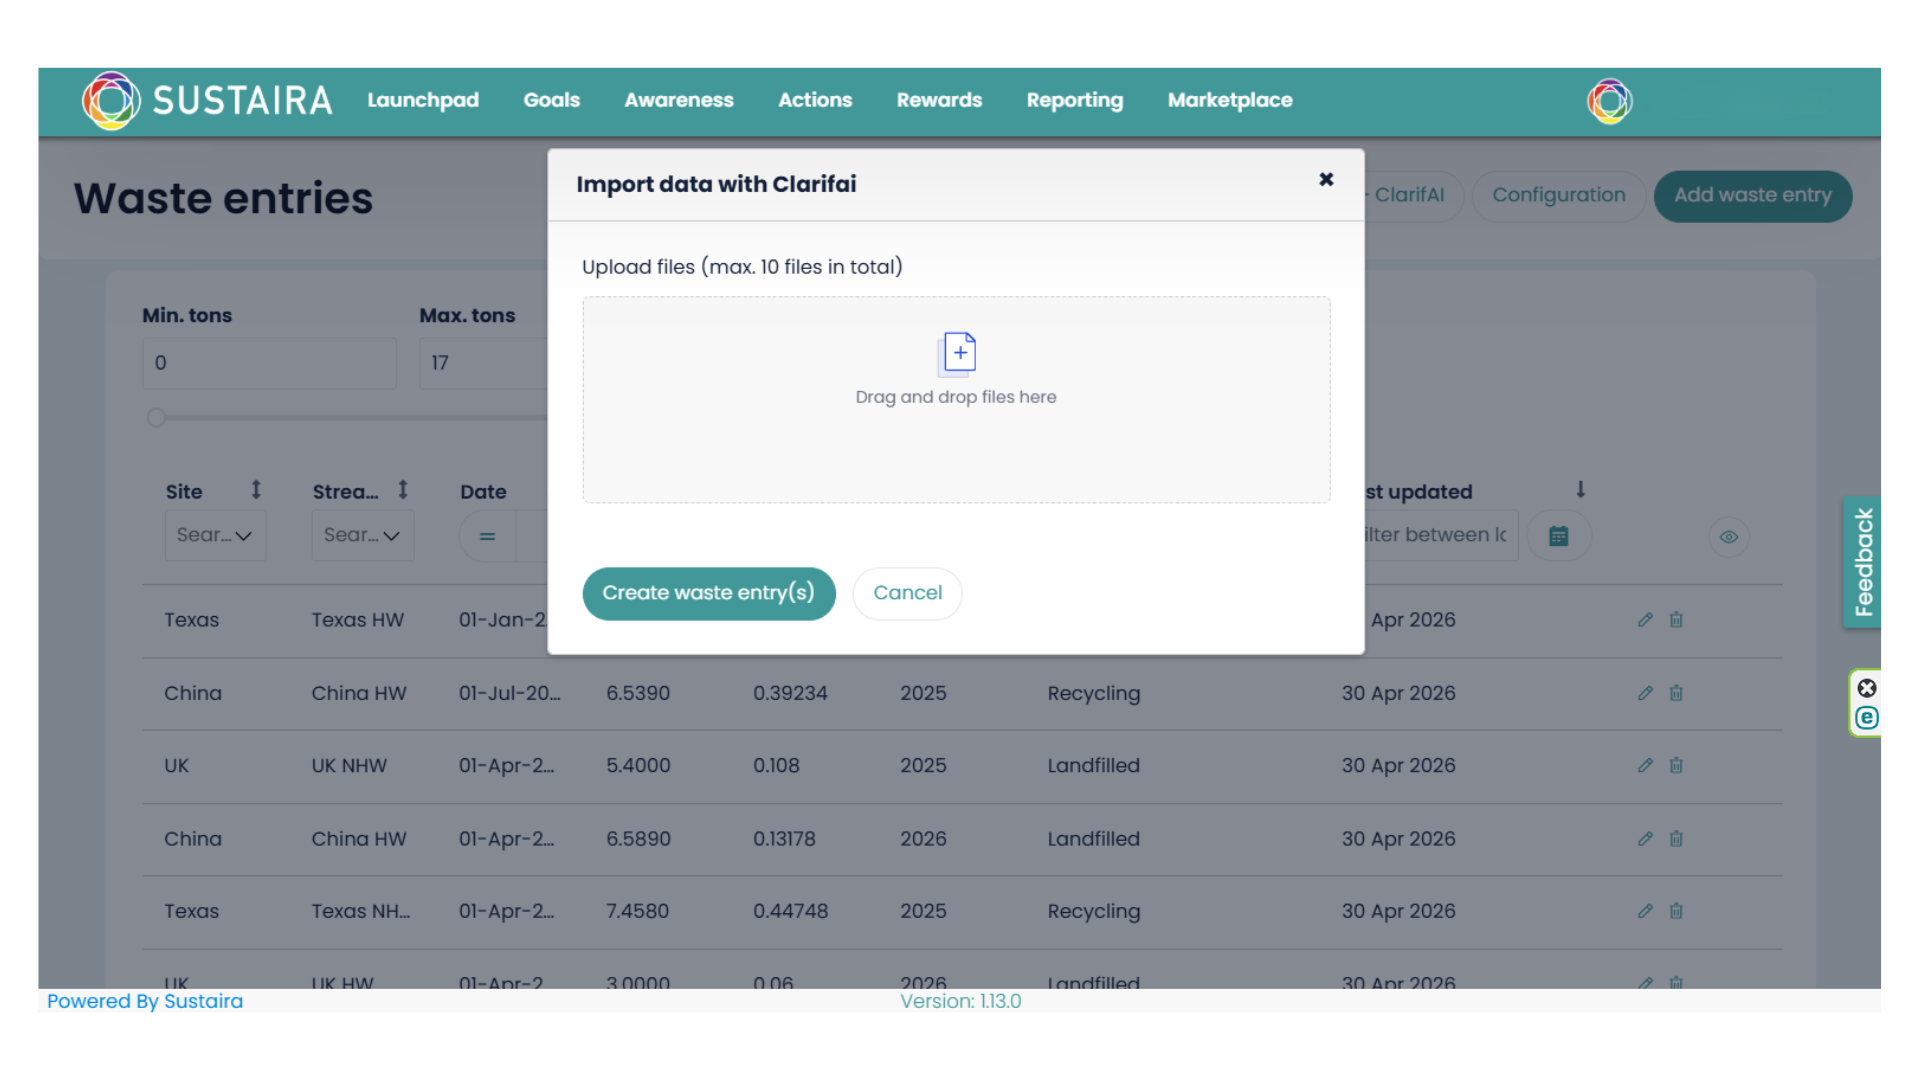
Automated Data Extraction (OCR)
Extract waste data directly from unstructured documents such as invoices and reports, reducing manual input and improving efficiency.
-
Organizational Data Roll-Up
Seamlessly consolidate waste data across subsidiaries, business units, and geographies for group-wide reporting and analysis.
-
Flexible Configuration
Adapt the data model, workflows, and reporting structures to match your organization’s specific waste management requirements.

Get a Personalized Demo
The Sustaira Waste Management Solution transforms waste management from a fragmented and manual process into a structured, data-driven capability. By centralizing waste data, automating ingestion, and ensuring consistency in calculations, organizations gain the clarity needed to reduce waste, optimize disposal strategies, and improve environmental performance at scale.
Related Solutions
-

Sustainability Launchpad
A unified dashboard that centralizes all your Sustaira sustainability solutions, apps, and connectors—tailored to your needs with the tools that matter most.
-

Projects & KPIs Tracker
A centralized module to define and track your sustainability projects. Connect them to UN SDGs, manage tasks and KPIs, and oversee your organization’s sustainability progress.
-

Carbon Accounting
A centralized solution that provides organizations with both an overview and granular detail of their Scope 1, 2, and 3 emissions.
-

Disclosures and Reporting
Transforms ESG disclosures into a streamlined process with a flexible framework aligned to standards like CSRD, CDP, PCAF, SASB and more.
-

Sustainability Planner
Aligned with SBTi, this solution previews results based on different scenarios. By adjusting different KPIs you can see impacts in real time and make informed decisions to reach your decarbonization goals.
-

Contractors Commitment Solution
Streamlines ESG and sustainability data collection with configurable surveys, task management, reminders, and reporting for both quantitative and qualitative initiatives.
-

Stakeholders and Supplier Survey
Enables efficient ESG and sustainability data collection from multiple stakeholders. Configurable surveys, task management, reminders, and reporting support both quantitative and qualitative initiatives.
-

Materiality Assessment
Enables a dynamic materiality assessment that evolves with shifting goals and policies.
-

Carbon Footprint, Waste and Emissions Calculators
Helps organizations calculate their carbon footprint by tracking energy metrics and converting usage into CO₂ equivalents.
-

Diversity, Equity & Inclusion
Gain clear insights into workforce metrics such as compensation changes, promotions, performance outcomes, and representation trends, while receiving alerts on emerging patterns and tracking progress over time.
-

Carbon Offsetting Solution
Empowers employees to understand and offset their personal carbon footprint. By calculating emissions from expenses such as flights, they can choose to contribute toward CO₂ offset initiatives.
-

Employee Travel Emissions Solution
Aggregates and calculates employee travel emissions via reimbursement integration or manual entry, and pairs with the Carbon Offsetting program for footprint review and offsetting.
-

Engagement and Rewarding Solution
Tracks and rewards user progress, encouraging sustainable actions like carpooling or remote work through competitions, points, and recognition.
-

Supplier Management
A customizable solution for streamlined data intake from suppliers. Replace spreadsheets and emails with tailored questionnaires, while setting actions, reminders, and parameters per supplier.
-

And More
New solutions are continually added, alongside bespoke applications designed to meet specific client sustainability goals