
Diversity, Equity & Inclusion
Organizations are expected to maintain employment practices that are consistent, transparent, and aligned with internal policies and regulatory requirements. Achieving this requires reliable visibility into workforce outcomes such as compensation adjustments, promotions, and performance results.
In many organizations, however, workforce data is dispersed across HR systems and internal reports, making it difficult to review trends, maintain consistent oversight, and ensure that employment processes are applied uniformly across teams and locations.
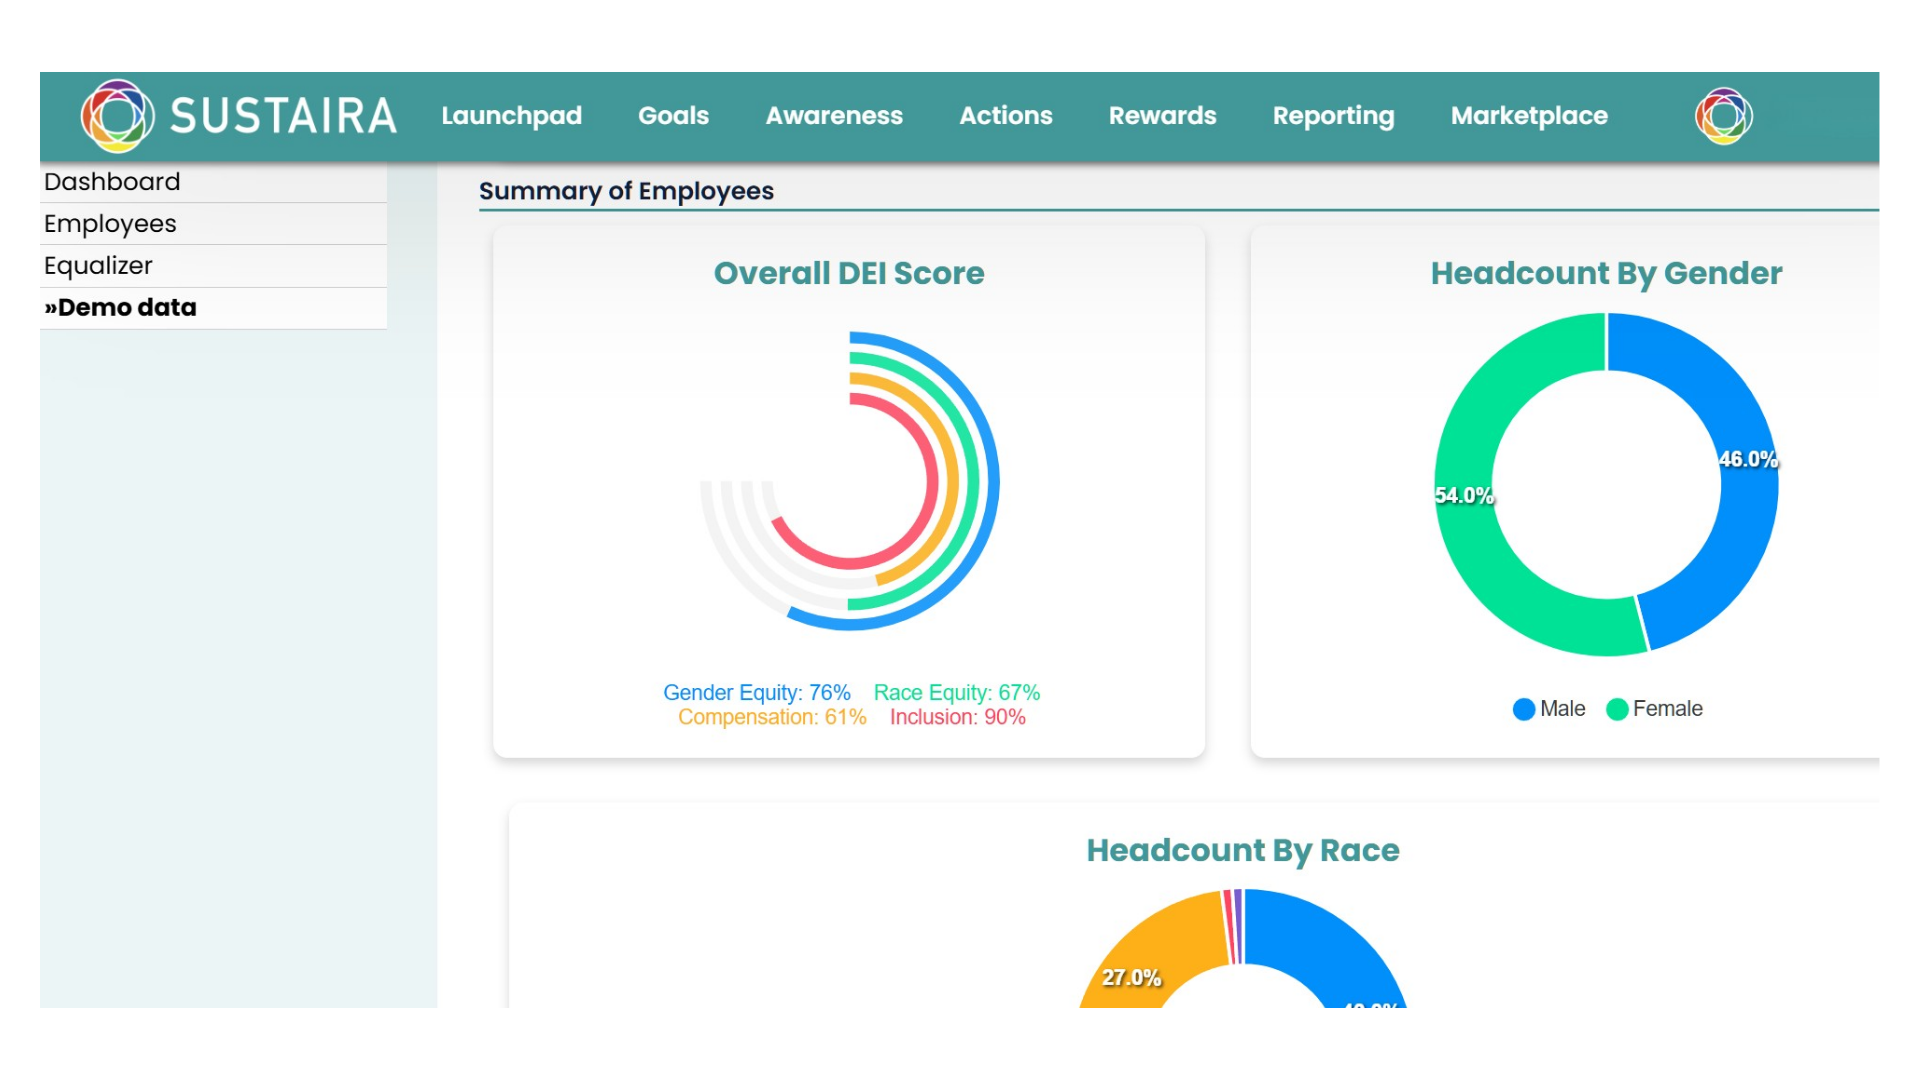
The Sustaira Diversity, Equity & Inclusion solution provides a structured analytical environment to monitor workforce metrics and review employment outcomes across the organization. Through configurable dashboards and visual analytics, leadership teams gain clearer insight into workforce patterns and operational processes.
By transforming workforce data into accessible insights, the platform helps organizations strengthen workforce governance, improve transparency in employment reporting, and support consistent talent management practices.
Trusted by
Turning Complexity into Clarity
-
Workforce information related to compensation, promotions, and performance often resides across different HR systems and internal reports, limiting visibility.
With Sustaira DEI
Workforce metrics are consolidated into a unified analytical environment, providing a clear and structured overview of employment outcomes across the organization. -
Without consistent monitoring tools, it can be difficult for organizations to understand how employment outcomes evolve over time.
With Sustaira DEI
Interactive dashboards provide continuous visibility into workforce metrics, enabling leadership teams to review trends and monitor key indicators. -
Workforce reporting frequently relies on manual data compilation across multiple systems, increasing operational complexity.
With Sustaira DEI
Automated data aggregation simplifies workforce analysis and provides up to date insight through visual reporting and dashboards. -
Organizations may find it difficult to communicate workforce insights consistently across leadership teams and governance structures.
With Sustaira DEI
Structured dashboards and reporting tools enable clear communication of workforce metrics and support stronger internal oversight.
Core Features
-
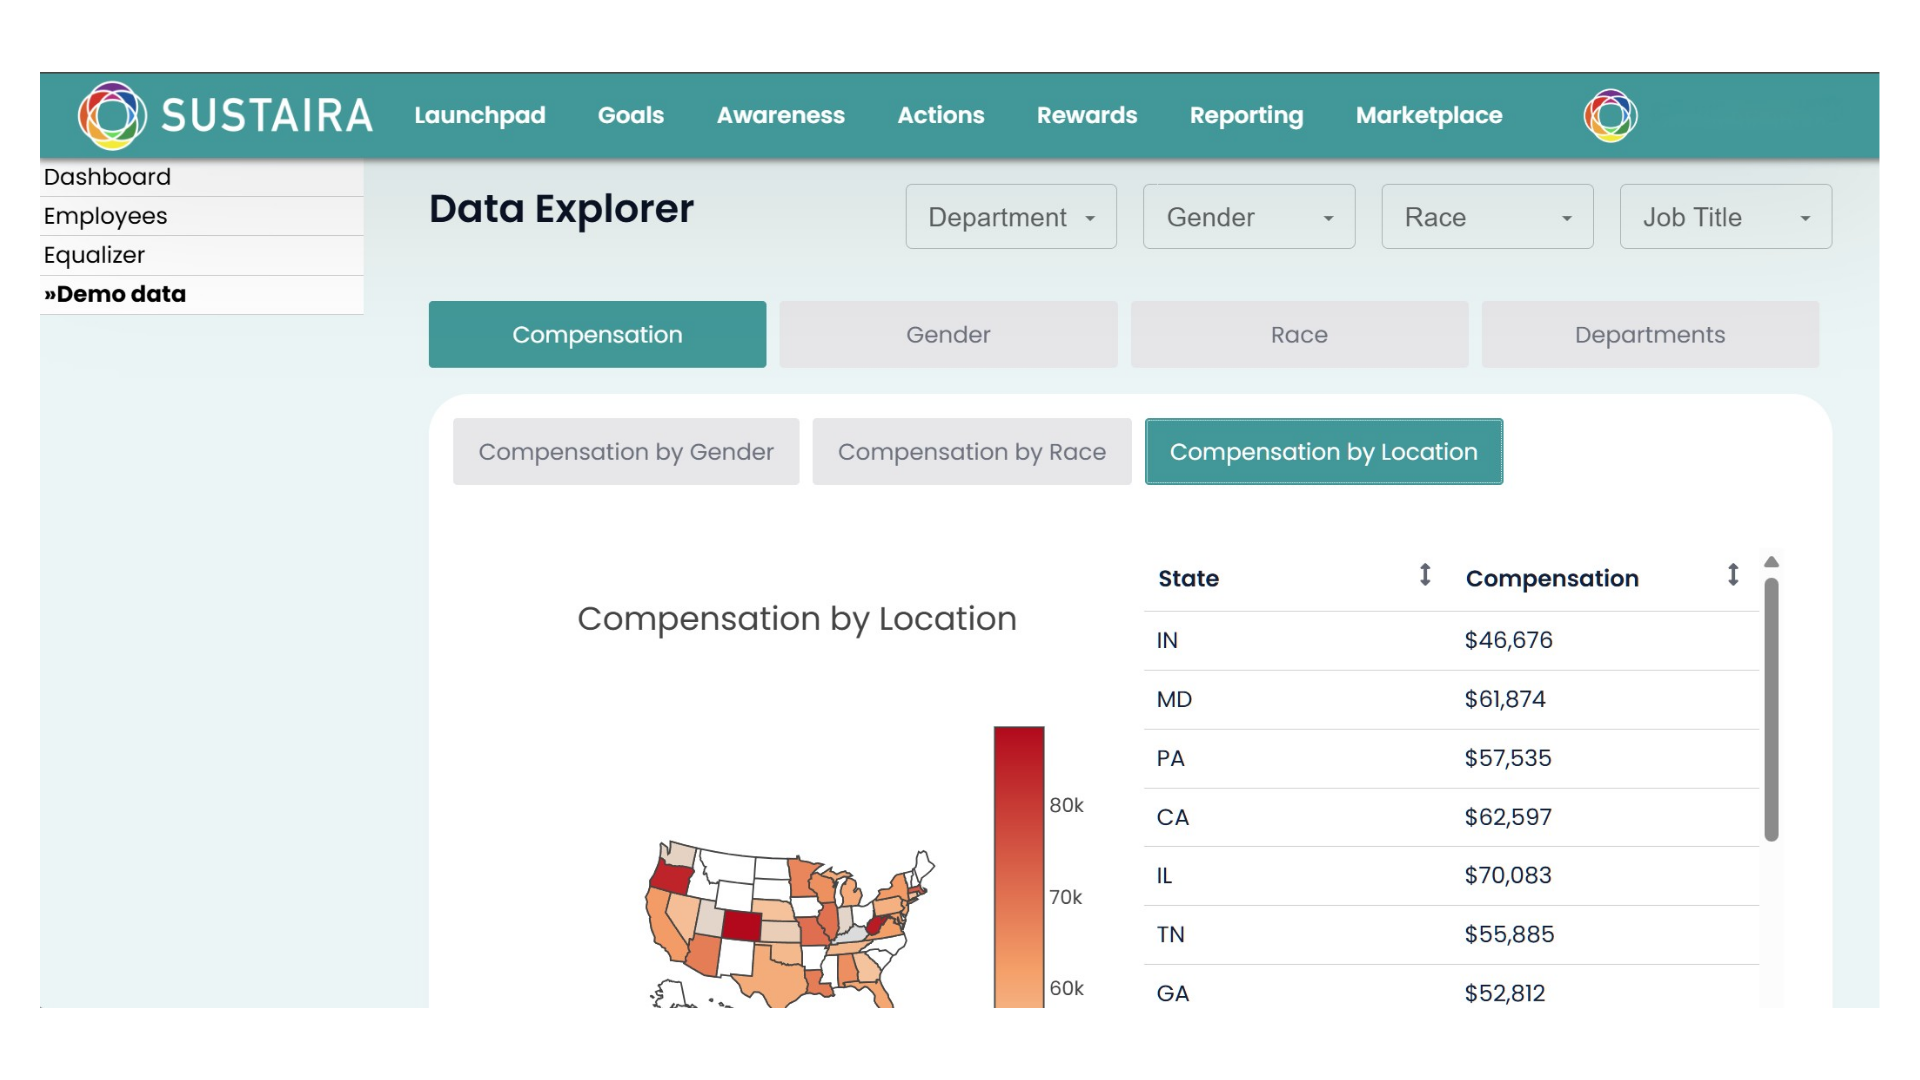
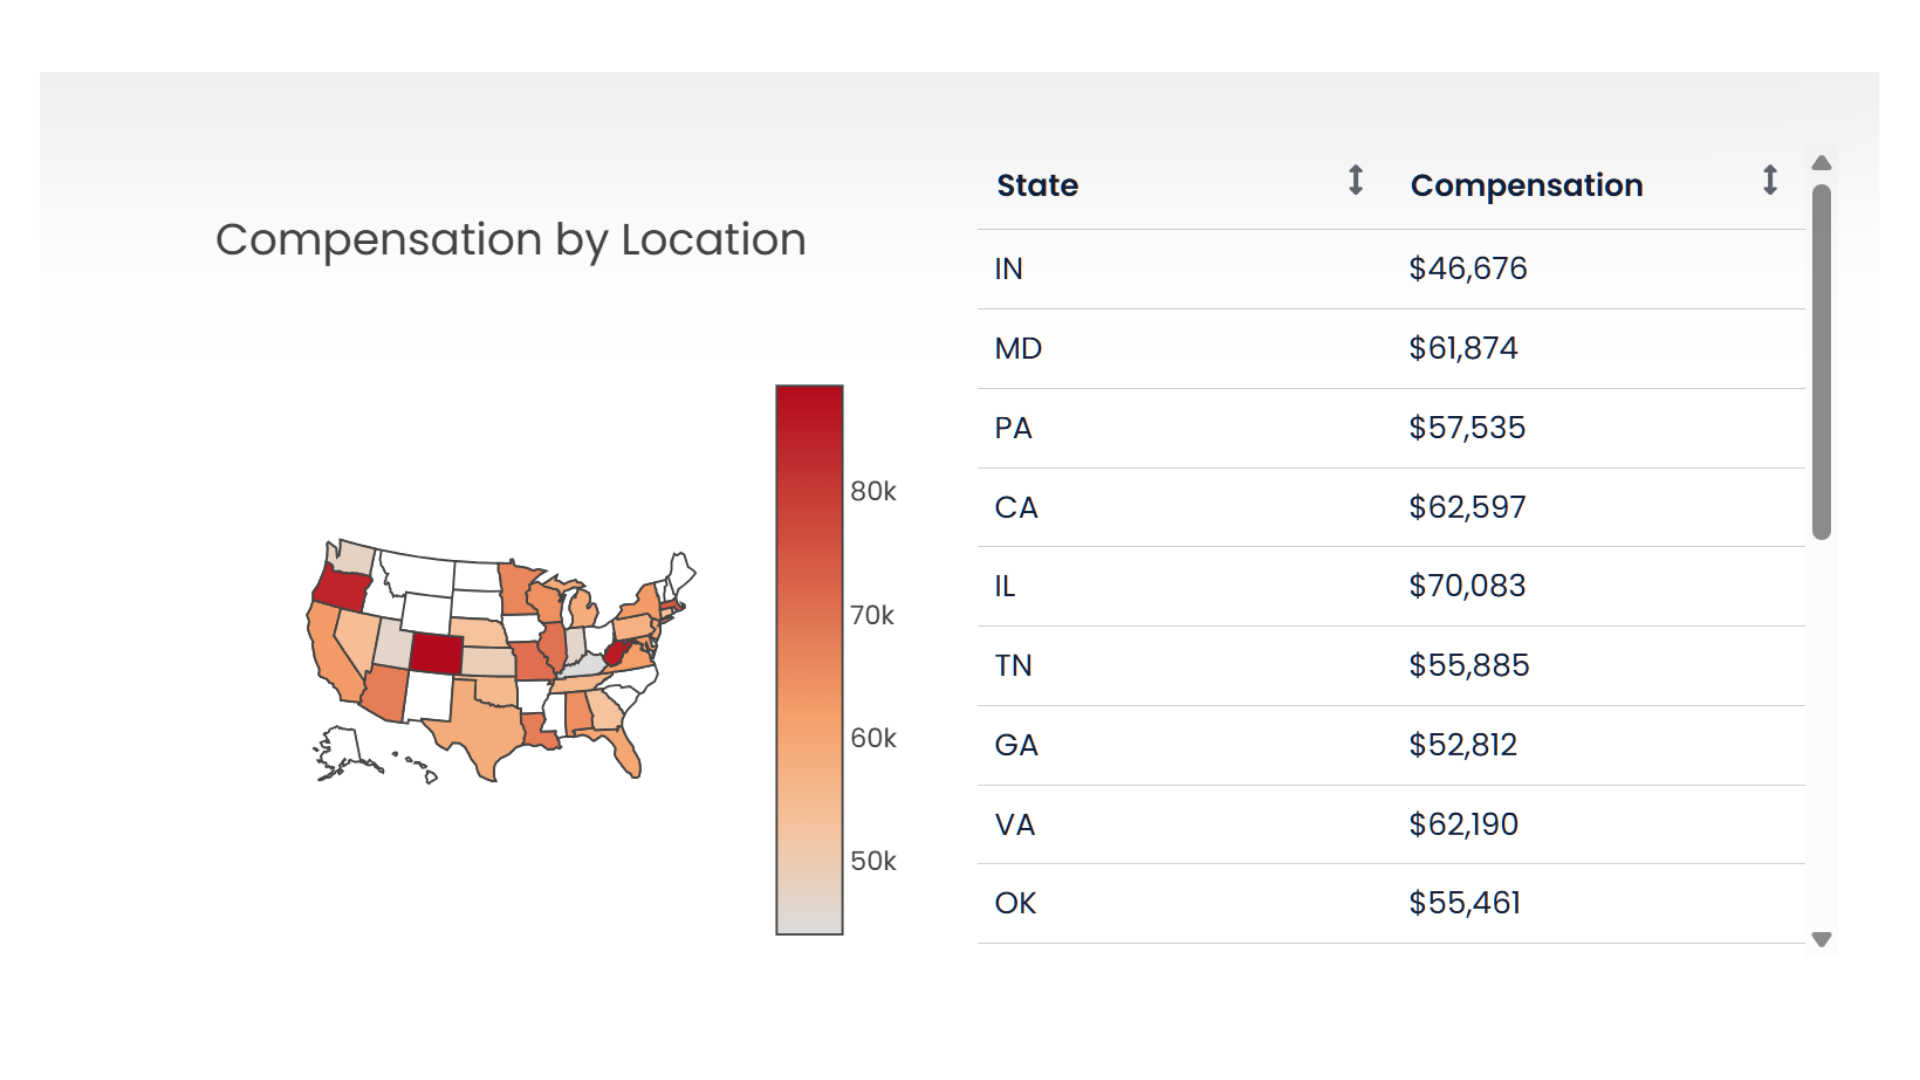
Workforce Analytics Dashboards
Interactive dashboards provide clear visibility into workforce metrics such as compensation adjustments, promotions, and performance outcomes.
-
Integration with HR and Enterprise Systems
The platform integrates with existing HR platforms and enterprise systems, allowing workforce data to be automatically aggregated and analyzed.
-
Trend Monitoring and Insights
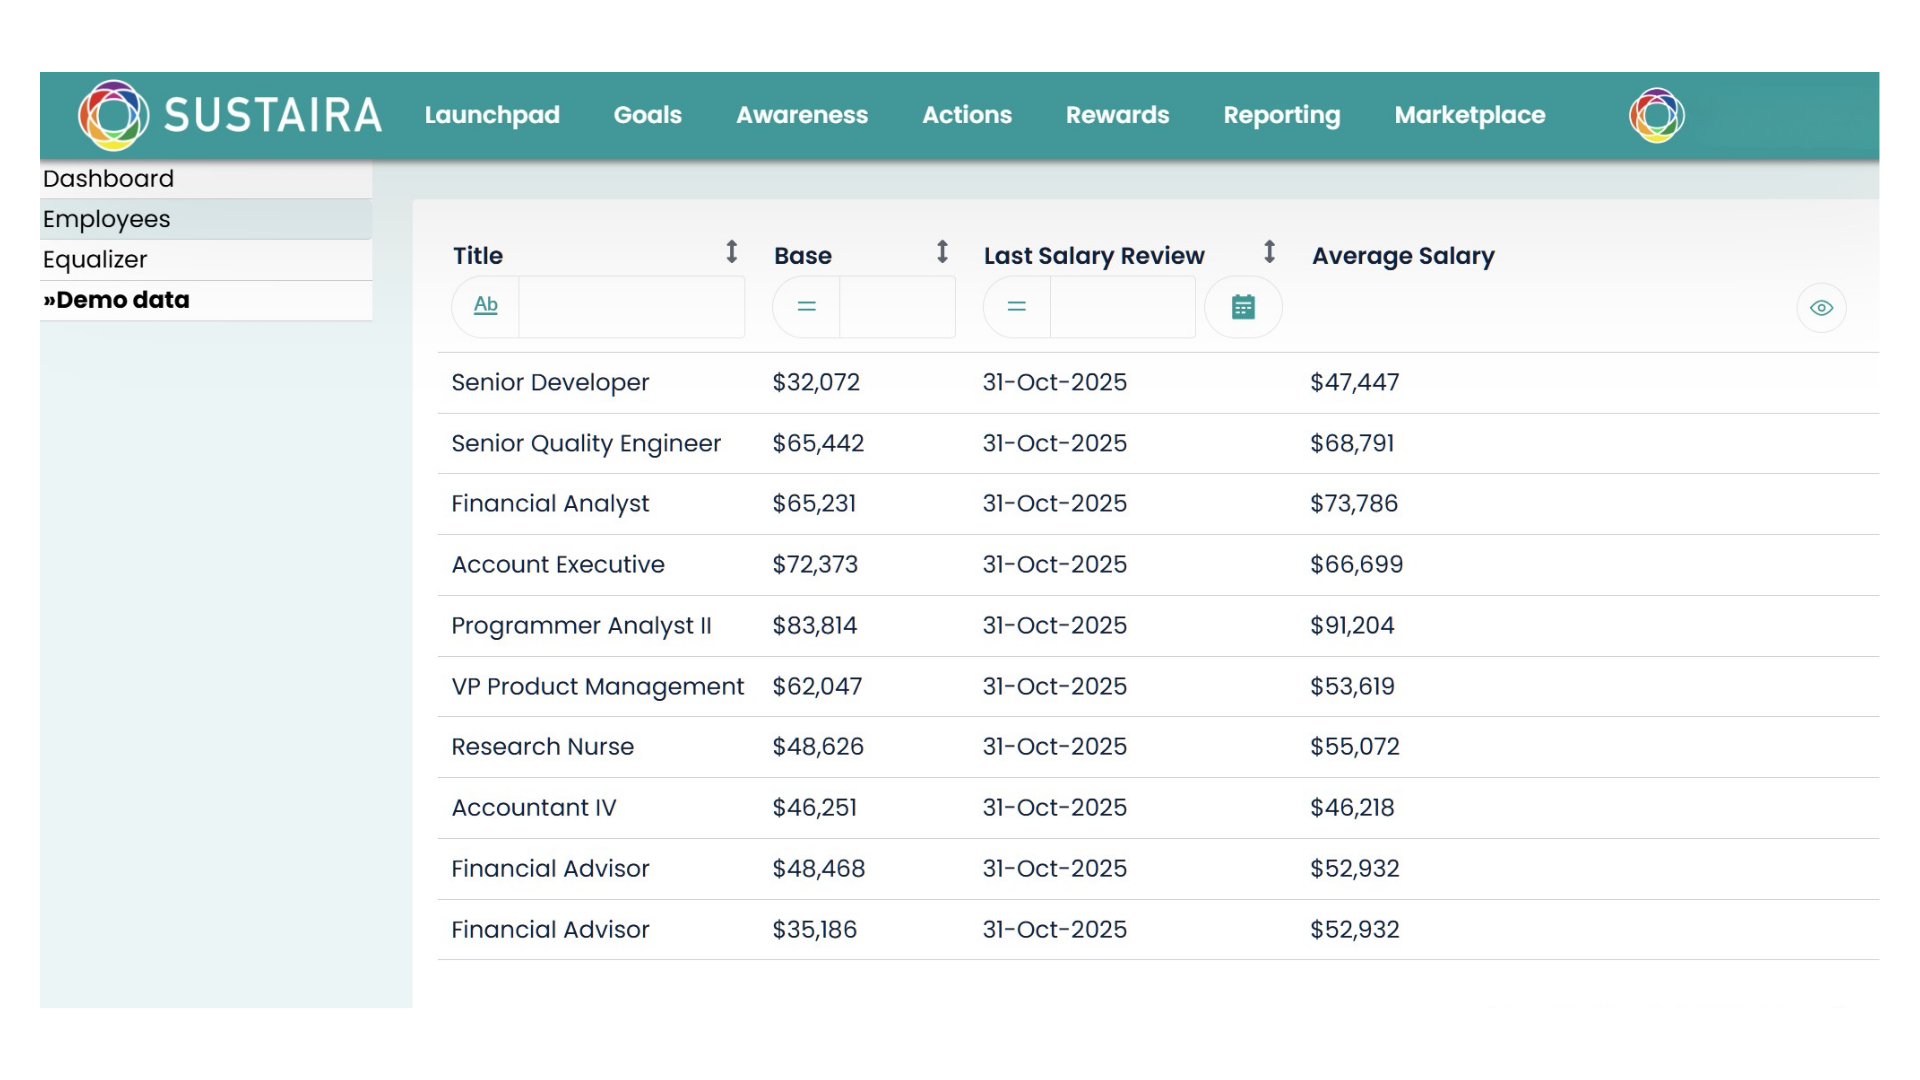
Built in analytics tools allow organizations to monitor workforce trends and review patterns across different teams, locations, or time periods.
-
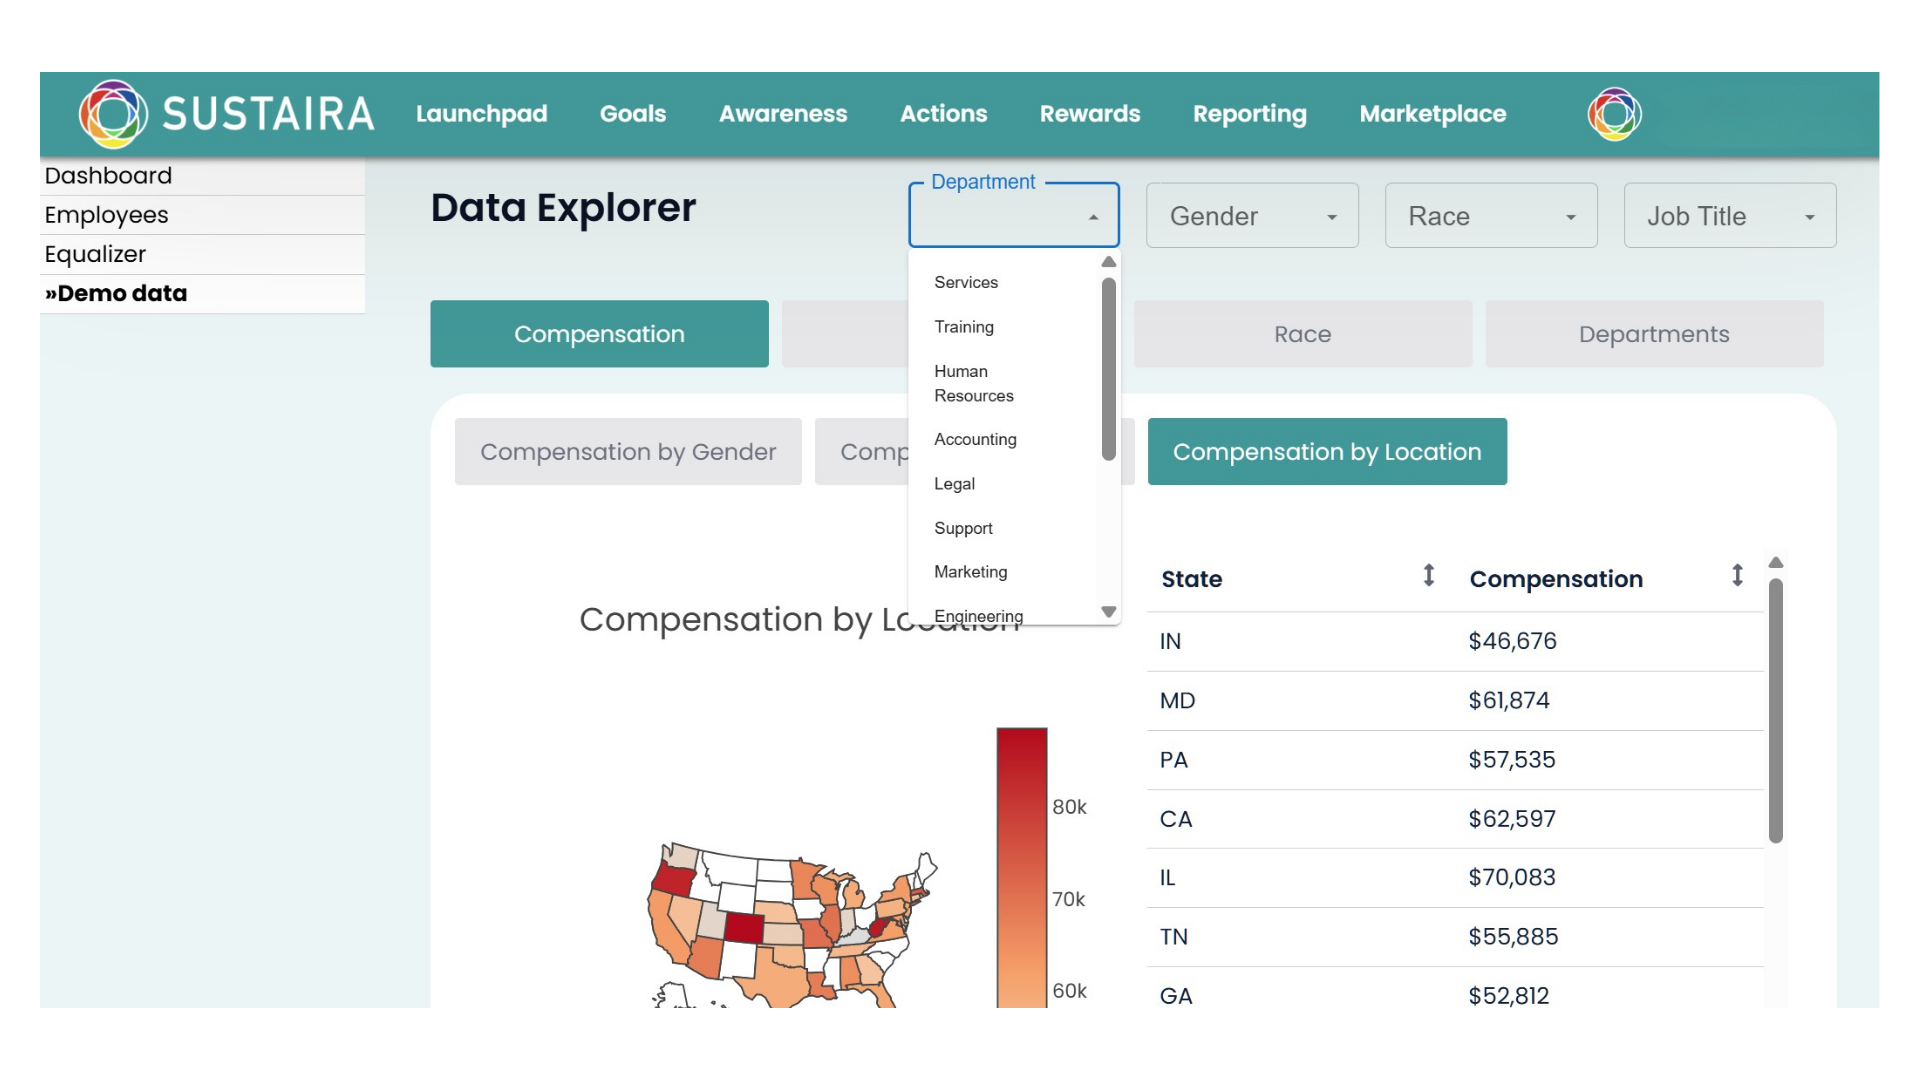
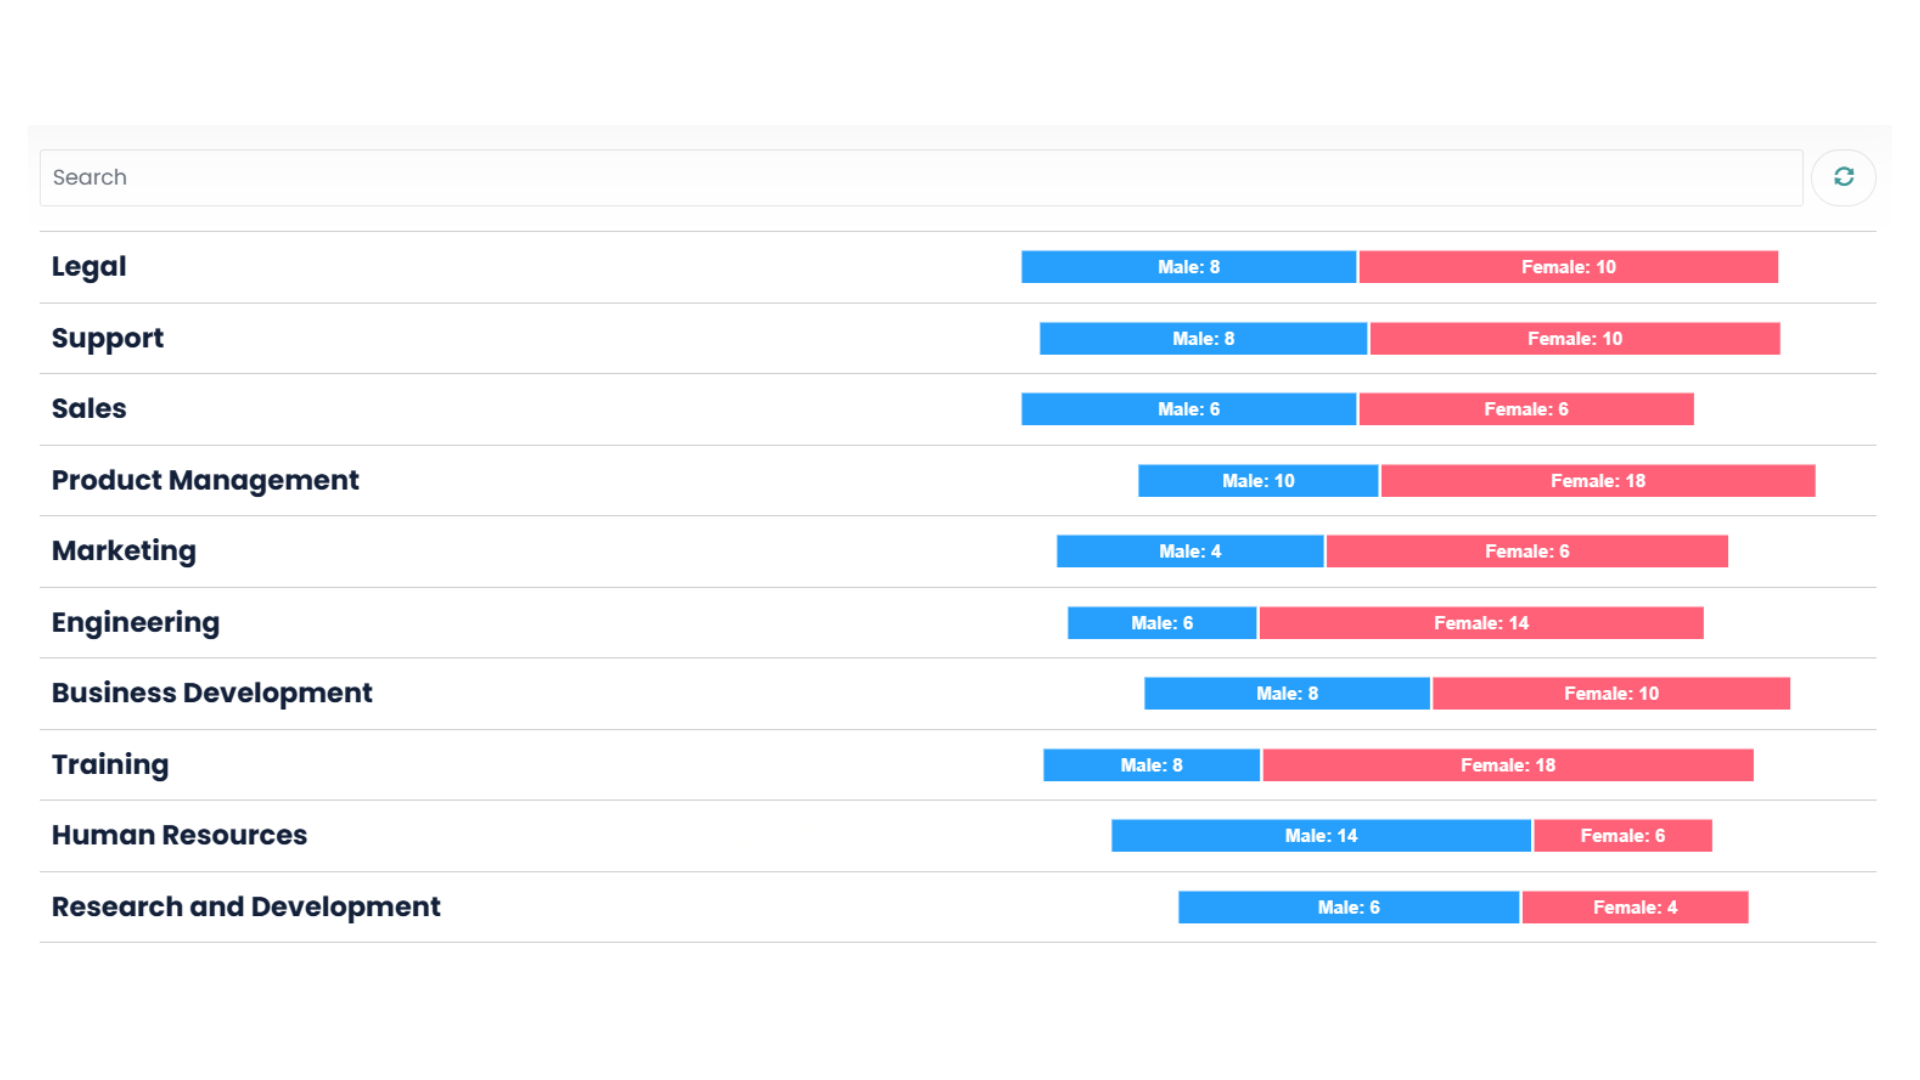
Configurable Workforce Segmentation
Organizations can analyze workforce data across different segments such as departments, locations, or operational units.
-

Flexible Low Code Architecture
Sustaira’s low code architecture enables rapid customization and expansion. New functionalities, integrations, and workflows can be configured quickly without heavy IT development.

Get a Personalized Demo
The Sustaira DEI solution helps organizations move beyond fragmented workforce reporting toward a structured and data driven approach to workforce insights.
By consolidating workforce data and enabling clear analytical visibility, organizations can strengthen internal oversight, support transparent reporting, and maintain consistent employment practices across their workforce.
Related Solutions
-

Sustainability Launchpad
A unified dashboard that centralizes all your Sustaira sustainability solutions, apps, and connectors—tailored to your needs with the tools that matter most.
-

Projects & KPIs Tracker
A centralized module to define and track your sustainability projects. Connect them to UN SDGs, manage tasks and KPIs, and oversee your organization’s sustainability progress.
-

Carbon Accounting
A centralized solution that provides organizations with both an overview and granular detail of their Scope 1, 2, and 3 emissions.
-

Disclosures and Reporting
Transforms ESG disclosures into a streamlined process with a flexible framework aligned to standards like CSRD, CDP, PCAF, SASB and more.
-

Sustainability Planner
Aligned with SBTi, this solution previews results based on different scenarios. By adjusting different KPIs you can see impacts in real time and make informed decisions to reach your decarbonization goals.
-

Waste Management
Track, standardize, and analyze waste data across sites and streams to improve visibility and drive better waste management decisions.
-

Contractors Commitment Solution
Streamlines ESG and sustainability data collection with configurable surveys, task management, reminders, and reporting for both quantitative and qualitative initiatives.
-

Stakeholders and Supplier Survey
Enables efficient ESG and sustainability data collection from multiple stakeholders. Configurable surveys, task management, reminders, and reporting support both quantitative and qualitative initiatives.
-

Materiality Assessment
Enables a dynamic materiality assessment that evolves with shifting goals and policies.
-

Carbon Footprint, Waste and Emissions Calculators
Helps organizations calculate their carbon footprint by tracking energy metrics and converting usage into CO₂ equivalents.
-

Carbon Offsetting Solution
Empowers employees to understand and offset their personal carbon footprint. By calculating emissions from expenses such as flights, they can choose to contribute toward CO₂ offset initiatives.
-

Employee Travel Emissions Solution
Aggregates and calculates employee travel emissions via reimbursement integration or manual entry, and pairs with the Carbon Offsetting program for footprint review and offsetting.
-

Engagement and Rewarding Solution
Tracks and rewards user progress, encouraging sustainable actions like carpooling or remote work through competitions, points, and recognition.
-

Supplier Management
A customizable solution for streamlined data intake from suppliers. Replace spreadsheets and emails with tailored questionnaires, while setting actions, reminders, and parameters per supplier.
-

And More
New solutions are continually added, alongside bespoke applications designed to meet specific client sustainability goals