Diversity, Equity & Inclusion
Organizations face significant challenges in moving beyond aspirational DEI statements to achieve measurable, auditable equity across their workforce. The failure to objectively track core metrics often results in unidentified systemic bias, increased compliance risk, and damage to talent attraction and retention. Without a dedicated tool, ensuring true equity across complex areas like compensation and promotion remains a manual, high-risk process.
The Sustaira Diversity, Equity & Inclusion (DEI) solution is designed to eliminate this operational blind spot. It provides organizations with the necessary quantitative framework to monitor, visualize, and actively manage equity goals. Utilizing comprehensive dashboards and charting, the solution offers clear visualization of critical metrics, such as raises, promotions, and performance, in relation to race, ethnicity, and gender. By providing a clear, continuous view of organizational equity, along with automated alerts for negative trends and recognition for goal achievement, the solution ensures accountability and enables proactive intervention to protect your talent and reputation.
Problem statement:
Lack of tracking DEI goals and results
Incapable to turn insight into actions
Lack of transparency and accountability
Solution value:
Real time dashboarding
Building blocks can rapidly be extended with features
Integration with back-end
Easy to share results internally and externally


Trusted by
Features and Functionalities
-

Dashboard your DEI Metrics
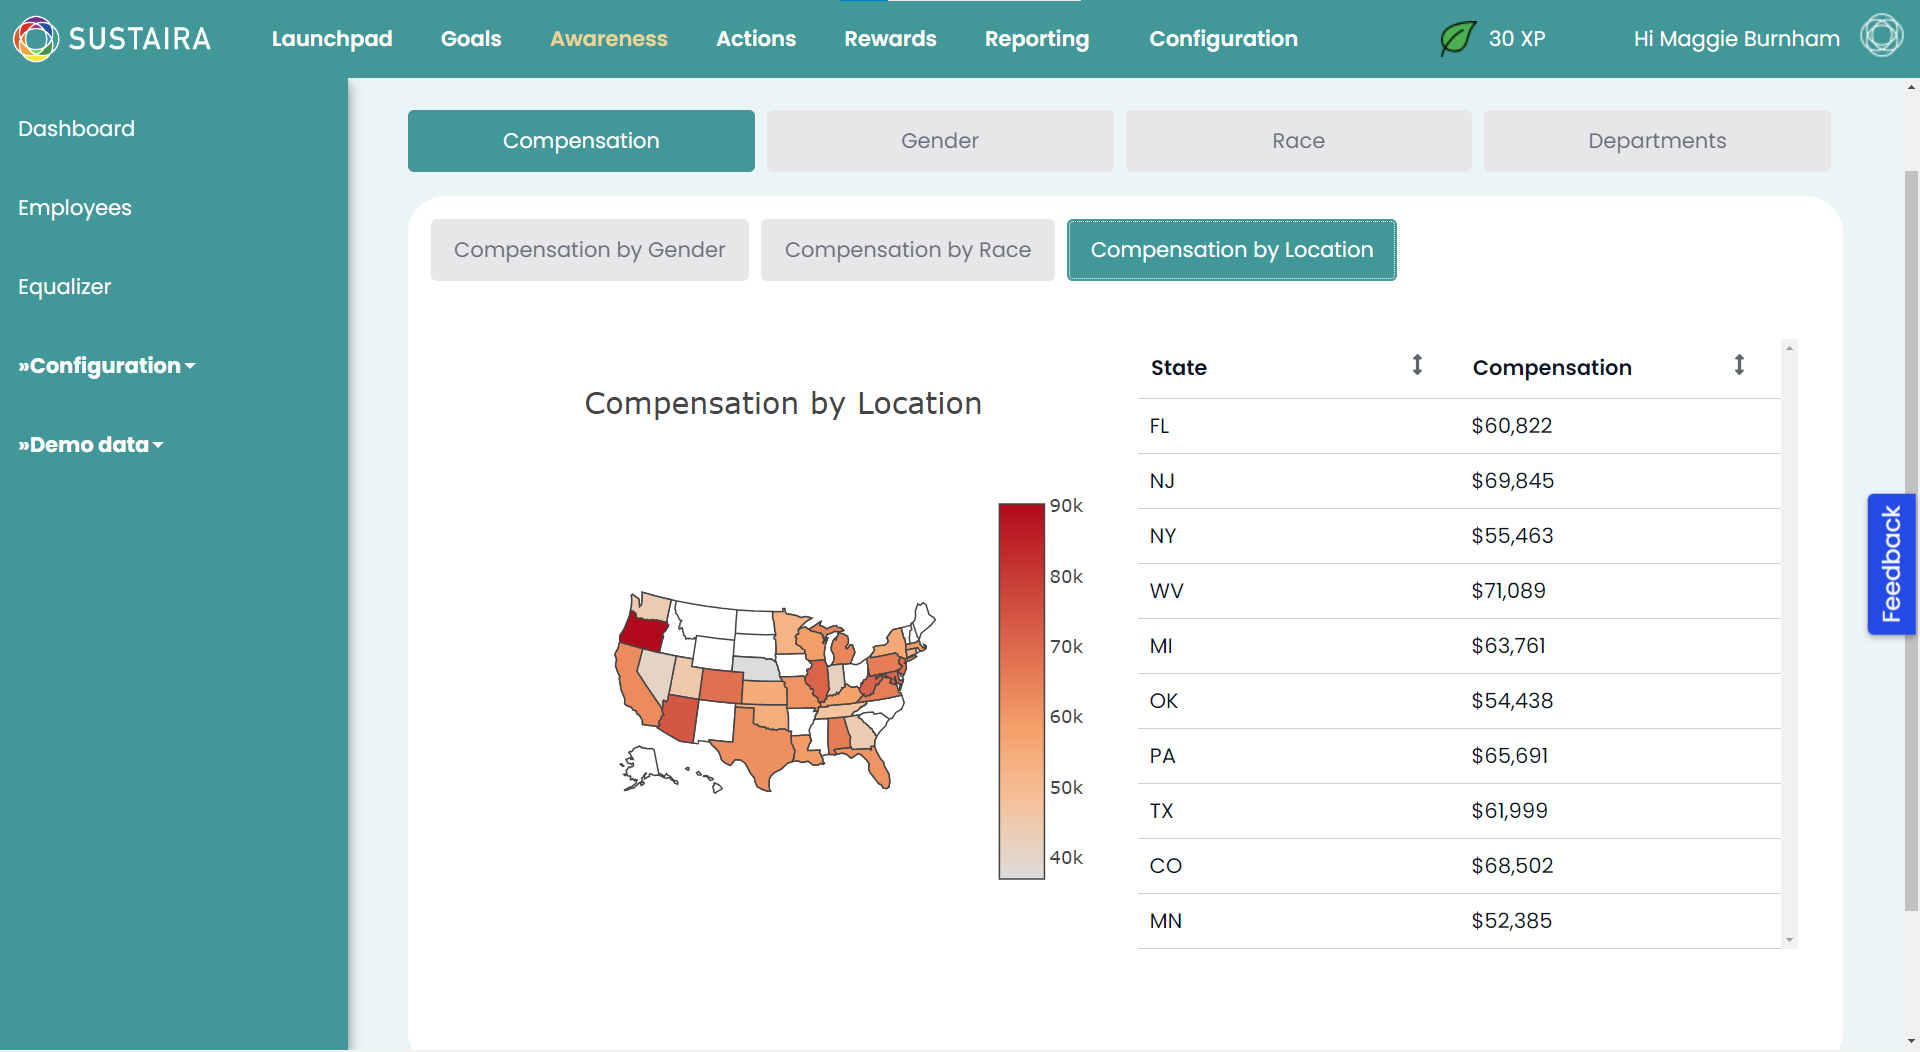
Aggregate all of your DEI Data in one space with easy to understand dashboards and visualizations. Track metrics like gender, race, equity, and more!
-

Get a Clear Overview of Employees
With Sustaira, you can easily look across all of your employees to ensure true diversity, equity, and inclusion. Set alerts to notify your organization is trending in the wrong direction, or get Kudos for reaching goals.
-

Easy Visualization of Metrics
Similar to our dashboard overviews, you can view metrics one by one with easy to understand visualizations. Everything can be filtered, separated, and viewed.
-

And More!
This is just a glimpse into the features and functionalities Sustaira applications offer. Features and functionality in addition to what is seen here can be rapidly added or customized!
More Solutions you might like
-

Sustainability Launchpad
A unified dashboard that centralizes all your Sustaira sustainability solutions, apps, and connectors—tailored to your needs with the tools that matter most.
-

Projects & KPIs Tracker
A centralized module to define and track your sustainability projects. Connect them to UN SDGs, manage tasks and KPIs, and oversee your organization’s sustainability progress.
-

Carbon Accounting
A centralized solution that provides organizations with both an overview and granular detail of their Scope 1, 2, and 3 emissions.
-

Sustainability Planner
Aligned with SBTi, this solution previews results based on different scenarios. By adjusting different KPIs you can see impacts in real time and make informed decisions to reach your decarbonization goals.
-

Materiality Assessment
Enables a dynamic materiality assessment that evolves with shifting goals and policies.
-

Disclosures and Reporting
Transforms ESG disclosures into a streamlined process with a flexible framework aligned to standards like GRI, CSRD, CDP, PCAF, SASB and more.
-

Diversity, Equity & Inclusion
Gain deeper insights into raises, promotions, performance, and representation by race, ethnicity, and gender—while receiving alerts for concerning trends and recognition for measurable progress.
-

Stakeholders and Supplier Survey
Enables efficient ESG and sustainability data collection from multiple stakeholders. Configurable surveys, task management, reminders, and reporting support both quantitative and qualitative initiatives.
-

Carbon Footprint, Waste and Emissions Calculators
Helps organizations calculate their carbon footprint by tracking energy metrics and converting usage into CO₂ equivalents.
-

Carbon Offsetting Solution
Empowers employees to understand and offset their personal carbon footprint. By calculating emissions from expenses such as flights, they can choose to contribute toward CO₂ offset initiatives.
-

Contractors Commitment Solution
Streamlines ESG and sustainability data collection with configurable surveys, task management, reminders, and reporting for both quantitative and qualitative initiatives.
-

Employee Travel Emissions Solution
Aggregates and calculates employee travel emissions via reimbursement integration or manual entry, and pairs with the Carbon Offsetting program for footprint review and offsetting.
-

Engagement and Rewarding Solution
Tracks and rewards user progress, encouraging sustainable actions like carpooling or remote work through competitions, points, and recognition.
-

Supplier Management
A customizable solution for streamlined data intake from suppliers. Replace spreadsheets and emails with tailored questionnaires, while setting actions, reminders, and parameters per supplier.
-

And More
New solutions are continually added, alongside bespoke applications designed to meet specific client sustainability goals


